matplotlib之pyplot教程
文章目录
- 1. pyplot介绍
- 2. 使用关键字字符串绘图
- 3. 使用分类变量绘图
- 4. 线条属性控制
- 5. 使用多个图形和坐标轴
- 6. 图中添加文本
- 使用数学表达式
- 使用注释文本
- 7. 对数轴和其他非线性轴
- 8. 总结
- 9. 参考文献
对matplotlib包中的pyplot模块的介绍。主要是对 matplotlib官方文档的转译。
1. pyplot介绍
matplotlib.pyplot是使matplotlib像MATLAB一样工作的命令样式函数的集合。 每个pyplot函数都会对图形进行一些更改:例如,创建图形,在图形中创建绘图区域,在绘图区域中绘制一些线,用标签装饰绘图等。在matplotlib.pyplot中通过调用函数保留图形的多种状态。
一个简单的例子:
import matplotlib.pyplot as plt
import numpy as np
import pandas as pdplt.plot([1, 2, 3, 4]) # 当参数中只有一个array那么,plot函数会认为这是y值得array,而默认为x的值是0-len(array)
plt.ylabel('some numbers')
plt.show()

plt.plot([1, 2, 3, 4], [1, 4, 9, 16])

对于每一对x, y参数,可以通过第三个可选参数(格式字符串)来指明绘图的颜色,线的类型等。格式字符串的字母和符号来自于MATLAB,将颜色字符串和线条样式字符串连接在一起。默认的格式字符串是“b-”,表示一条蓝色实线。
plt.plot([1, 2, 3, 4], [1, 4, 9, 16], 'ro') # 表示红色圆来绘图
plt.axis([0, 6, 0, 20]) # [xmin, xmax, ymin, ymax]
plt.show()

可以将所有的参数一次传递给plot()函数
t = np.arange(0., 5., 0.2)plt.plot(t, t, 'r--', t, t**2, 'bs', t, t**3, 'g^')
plt.show()

2. 使用关键字字符串绘图
在某些情况下,拥有某种格式的数据,该格式允许使用字符串访问特定变量。 例如,使用numpy.recarray或pandas.DataFrame。
Matplotlib允许为此类对象提供data关键字参数。 如果提供的话,您可以使用与这些变量相对应的字符串生成图。
data = {'a': np.arange(50),'c': np.random.randint(0, 50, 50),'d': np.random.randn(50)}
data['b'] = data['a'] + 10 * np.random.randn(50)
data['d'] = np.abs(data['d']) * 100plt.scatter('a', 'b', c='c', s='d', data=data)
plt.xlabel('entry a')
plt.ylabel('entry b')
plt.show()

3. 使用分类变量绘图
在pyplot中也可以使用分类变量进行绘图。matplotlib允许直接传递分类变量给许多绘图函数。例如:
names = ['group_a', 'group_b', 'group_c']
values = [1, 10, 100]plt.figure(figsize=(9, 3))plt.subplot(131)
plt.bar(names, values)
plt.subplot(132)
plt.scatter(names, values)
plt.subplot(133)
plt.plot(names, values)
plt.suptitle('Categorical Plotting')
plt.show()

4. 线条属性控制
线条有许多属性,例如,你可以设置线条宽度(linewidth),破折号样式(dash style),抗锯齿(antialiased)等。
通常设置线条属性的方法有如下几种:
# 1. 使用关键字参数
plt.plot(x, y, linewidth=2.0)# 2. 使用setter()方法
line, = plt.plot(x, y, '-')
line.set_antialiased(False) # 关闭抗锯齿# 3. 使用setp()函数。使用类似于MATLAB命令的方式,设置多个线条的多个属性
lines = plt.plot(x1, y1, x2, y2)
plt.setp(lines, color='r', linewidth=2.0) # 使用关键字参数
plt.setp(lines, 'color', 'r', 'linewidth', 2.0) # 使用MATLAB风格的字符串对
让我们看看线条有哪些属性可以设置呢?
In[69]: lines = plt.plot([1, 2, 3])In[70]: plt.setp(lines)
out[70]:agg_filter: a filter function, which takes a (m, n, 3) float array and a dpi value, and returns a (m, n, 3) array alpha: float (0.0 transparent through 1.0 opaque) animated: bool antialiased or aa: bool clip_box: a `.Bbox` instance clip_on: bool clip_path: [(`~matplotlib.path.Path`, `.Transform`) | `.Patch` | None] color or c: any matplotlib color contains: a callable function dash_capstyle: ['butt' | 'round' | 'projecting'] dash_joinstyle: ['miter' | 'round' | 'bevel'] dashes: sequence of on/off ink in points drawstyle: ['default' | 'steps' | 'steps-pre' | 'steps-mid' | 'steps-post'] figure: a `.Figure` instance fillstyle: ['full' | 'left' | 'right' | 'bottom' | 'top' | 'none'] gid: an id string label: object linestyle or ls: ['solid' | 'dashed', 'dashdot', 'dotted' | (offset, on-off-dash-seq) | ``'-'`` | ``'--'`` | ``'-.'`` | ``':'`` | ``'None'`` | ``' '`` | ``''``]linewidth or lw: float value in points marker: :mod:`A valid marker style <matplotlib.markers>`markeredgecolor or mec: any matplotlib color markeredgewidth or mew: float value in points markerfacecolor or mfc: any matplotlib color markerfacecoloralt or mfcalt: any matplotlib color markersize or ms: float markevery: [None | int | length-2 tuple of int | slice | list/array of int | float | length-2 tuple of float]path_effects: `.AbstractPathEffect` picker: float distance in points or callable pick function ``fn(artist, event)`` pickradius: float distance in pointsrasterized: bool or None sketch_params: (scale: float, length: float, randomness: float) snap: bool or None solid_capstyle: ['butt' | 'round' |  'projecting'] solid_joinstyle: ['miter' | 'round' | 'bevel'] transform: a :class:`matplotlib.transforms.Transform` instance url: a url string visible: bool xdata: 1D array ydata: 1D array zorder: float
5. 使用多个图形和坐标轴
MATLAB和pyplot都有当前图形和当前坐标轴的概念。所有的绘图命令都是应用在当前坐标轴上的。gca()函数返回当前坐标轴对象(matplotlib.axes.Axes的实例),gcf()函数返回当前图形对象(matplotlib.figure.Figure的实例)。通常情况下,我们不用关心这些,因为已经由matplotlib在后台进行处理好了。
让我们来创建两个子图:
def f(t):return np.exp(-t) * np.cos(2*np.pi*t)t1 = np.arange(0.0, 5.0, 0.1)
t2 = np.arange(0.0, 5.0, 0.02)plt.figure()
plt.subplot(211)# 这个三位整数表示的该子图的位置,2为numrows,第1个1为numcols,第二个1为index,综合信息就是在当前figure中有2行1列(也就是2*1个子图),而本子图的索引位置是1.
# 等价于plt.subplot(2, 1, 1)
plt.plot(t1, f(t1), 'bo', t2, f(t2), 'k')plt.subplot(212)
plt.plot(t2, np.cos(2*np.pi*t2), 'r--')
plt.show()

figure()函数是可选的,因为默认情况下会自动调用figure(1),同样的如果没有手动指明任何坐标轴,那么也会默认调用subplot(111)。subplot()函数指明了numrows,numcols,plot_number(取值范围:1~numrows*numcols)
我们可以创建任意个子图和坐标轴。如果想要手动放置一个坐标轴(即不在矩形网格上),可以使用axes()函数。axes((left, bottom, width, height))指明了当前子图在figure中的坐标和宽高。
当然,也可以通过调用多次figure()函数创建多个图形。
plt.figure(1) # 创建第一个图形
plt.subplot(211) # 创建第一个图形中的第一个子图
plt.plot([1, 2, 3])
plt.subplot(212) # 创建第一个图形中的第二个子图
plt.plot([4, 5, 6])plt.figure(2) # 创建第二个图形
plt.plot([4, 5, 6])plt.figure(1)
plt.subplot(211)
plt.title('Easy as, 1, 2, 3')


使用clf()和cla()分别清除当前图形和当前坐标轴。
需要注意的是
在显式调用close()关闭图形之前,图形所占的内存并不会完全释放。即使你已经删除了该图形的所有引用,也是这样。原因是在pyplot内部还保持对该图形的引用(除非调用了close())。
6. 图中添加文本
text()函数被用来在任意位置添加文本,xlabel()函数,ylabel()函数和title()函数是在指定位置添加文本。
mu, sigma = 100, 15
x = mu + sigma * np.random.randn(10000)n, bins, patches = plt.hist(x, 50, density=1, facecolor='g', alpha=0.75) # 直方图plt.xlabel('Smarts')
plt.ylabel('Probability')
plt.title('Histogram of IQ')
plt.text(60, .025, r'$\mu=100,\ \sigma=15$')
plt.axis([40, 160, 0, 0.03]) # x和y的取值范围,[xmin, xmax, ymin, ymax]
plt.grid(True)
plt.show()

所有的这些文本命令都是返回一个matplotlib.text.Text实例对象。与线条属性类似地,我们也可以通过传递关键字参数给文本函数或者setp()来实现自定义文本属性。
t = plt.xlabel('my data', fontsize=14, color='red')
使用数学表达式
在matplotlib中的任意文本中都可以使用TeX方程表达式。例如,在标题中写σi=15 ,可以像如下这些写:
plt.title(r'$\sigma_i=15$')
使用注释文本
在图中使用文本通常都是用作注释,那么就会用到annotate()方法了。在写注释的时候,需要考虑两点:要注释的位置(参数xy,表示需要注释的点的坐标)和注释文本的位置(参数xytext,表示注释文本的坐标)
ax = plt.subplot(111)t = np.arange(0.0, 5.0, 0.01)
s = np.cos(2*np.pi*t)
line, = plt.plot(t, s, lw=2)plt.annotate('local max', xy=(2, 1), xytext=(3, 1.5), arrowprops=dict(facecolor='black', shrink=0.05))plt.ylim(-2, 2) # y的取值范围
plt.show()

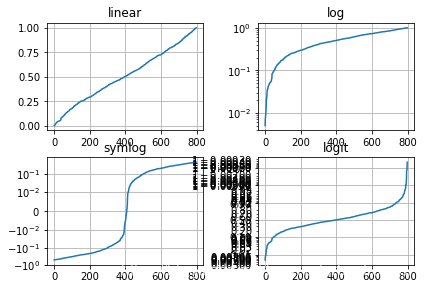
7. 对数轴和其他非线性轴
matplotlib不仅支持线性轴还支持对数轴等其他非线性轴。
那么在什么情况下使用对数轴呢?通常是在,数据跨多个数量级的时候。
使用plt.xscale(‘log’)和plt.yscale(‘log’)可以将scale修改为对数。
from matplotlib.ticker import NullFormatter # useful for logit scalenp.random.seed(19680801)y = np.random.normal(loc=0.5, scale=0.4, size=1000)
y = y[(y >0) & (y < 1)]
y.sort()
x = np.arange(len(y))plt.figure()# linear
plt.subplot(221)
plt.plot(x, y)
plt.yscale('linear')
plt.title('linear')
plt.grid(True)# log
plt.subplot(222)
plt.plot(x, y)
plt.yscale('log')
plt.title('log')
plt.grid(True)# symmetric log,对称对数
plt.subplot(223)
plt.plot(x, y -y.mean())
plt.yscale('symlog', linthreshy=0.01)
plt.title('symlog')
plt.grid(True)# logit
plt.subplot(224)
plt.plot(x, y)
plt.yscale('logit')
plt.title('logit')
plt.grid(True)plt.subplots_adjust(top=0.92, bottom=0.08, left=0.10, right=0.95, hspace=0.25, wspace=0.35)plt.show()
当然也可以自定子属于自己的scale。
8. 总结
对matplotlib包中的pyplot模块的介绍。主要是对matplotlib官方文档的转译。
9. 参考文献
[1] matplotlib官方文档